
Understanding RSI: A Complete Guide to the Relative Strength Index
The Relative Strength Index (RSI) is one of the most widely used indicators in technical analysis. More than just a number, RSI measures the momentum behind price moves, offering traders insight into potential shifts in market sentiment and the likelihood of reversals.
What is RSI?
Developed by J. Welles Wilder Jr. in 1978, RSI is a momentum oscillator that ranges from 0 to 100. Its main purpose is to determine whether a stock is overbought, oversold, or in a neutral zone.
In simple terms, RSI helps answer the question: Has the market moved too far, too fast, in one direction?
How RSI Works
RSI compares the magnitude of recent gains to recent losses over a set period—most commonly 14 periods (days, hours, minutes, depending on your chart). The calculation produces a value plotted between 0 (extremely weak) and 100 (extremely strong).
RSI Formula (Step-by-Step)
- Choose a Lookback Period: Standard = 14 periods.
- Calculate Price Changes: Change = Current Price − Previous Price. Gains are positive changes, losses are the absolute value of negative changes.
- Calculate Initial Averages (first RSI calculation only):
Average Gain = Sum of Gains over 14 periods / 14
Average Loss = Sum of Losses over 14 periods / 14 - Calculate Relative Strength (RS): RS = Average Gain / Average Loss
- Calculate RSI: RSI = 100 − (100 / (1 + RS))
- For Subsequent Periods (Wilder’s smoothing):
Average Gaintoday = ((Prev Avg Gain × 13) + Current Gain) / 14
Average Losstoday = ((Prev Avg Loss × 13) + Current Loss) / 14
Then repeat steps 4–5.
Example Calculation
If over 14 days:
- Avg Gain = 1.2
- Avg Loss = 0.8
Then:
RS = 1.2 / 0.8 = 1.5
RSI = 100 − (100 / (1 + 1.5)) = 60 → Neutral-to-bullish momentum.
Why RSI Can Be Effective
Markets move in waves—they rise, pull back, consolidate, and repeat. When RSI reaches extreme levels, it often reflects emotional extremes:
- High RSI: Overextended buying.
- Low RSI: Panic selling.
These extremes rarely last. RSI highlights moments when momentum may slow or reverse. Think of it as a market thermometer:
- Too high → Fever (Overbought)
- Too low → Chill (Oversold)
Interpreting RSI Levels
- Neutral RSI (~50): Balanced momentum between buyers and sellers. Often seen in consolidations.
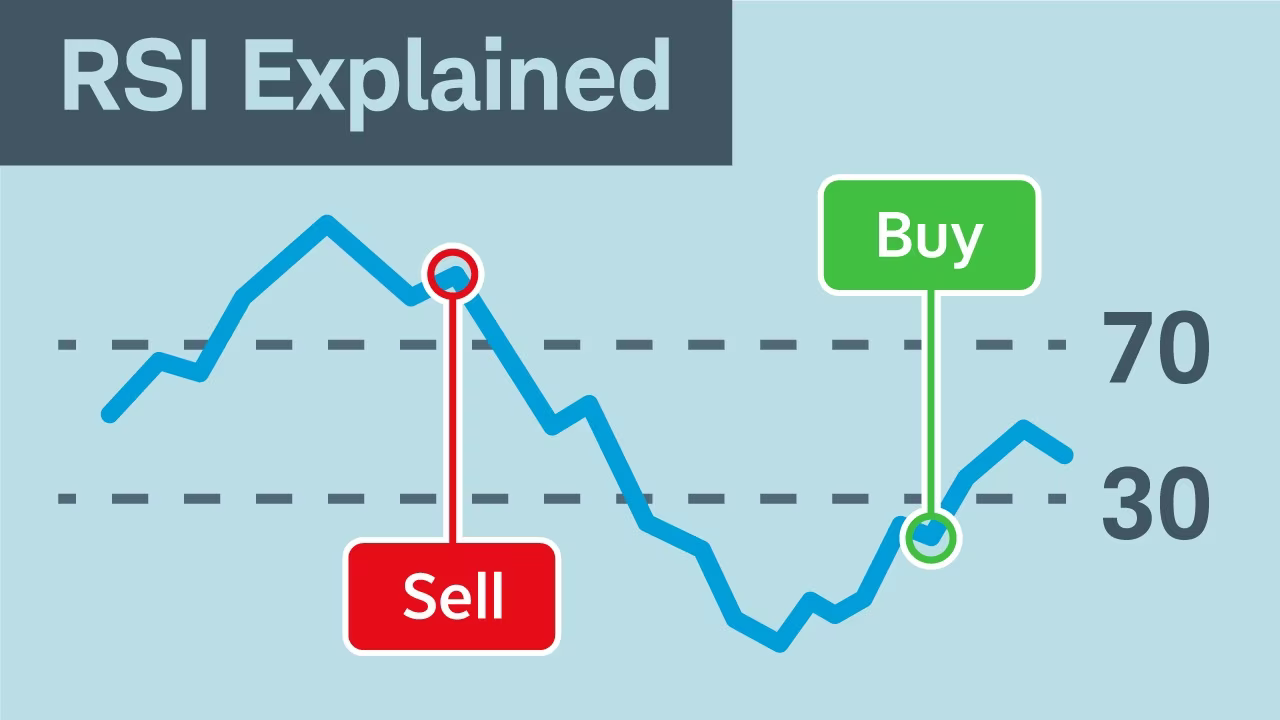
Example: Stock XYZ at RSI 51, moving steadily with normal pullbacks. No urgent signal—wait for a break above 60 or below 40. - High RSI (>70) — Caution: Potential overbought condition. Risk of a pullback rises.
Example: Stock ABC rallies 20% in a week; RSI hits 78. Traders may tighten stops, take profits, or avoid chasing. - Low RSI (<30) — Potential Opportunity: Signals oversold conditions where selling might be overdone.
Example: Stock DEF falls from $80 to $60 in three weeks; RSI is 25. A bullish divergence could hint at a reversal.
Practical Takeaways
- RSI is not predictive—it’s a context tool.
- Best used alongside price action, support/resistance, and volume.
- Extreme readings highlight where to look, not when to blindly act.
Backtesting Results — RSI Strategy vs. Buy & Hold

A backtest of the RSI-based trading strategy on Apple (2020-01-01 to 2025-08-11) offers several key takeaways. Compared to a Buy & Hold approach for both the S&P 500 ETF (SPY) and Apple stock, the RSI strategy produced noticeably different risk–return characteristics.
Trading Rules
- Buy Condition: RSI below 30
- Sell Condition: RSI above 70
Performance Metrics
- Total Return: 42.02%
- Sharpe Ratio: 0.19
- Win Rate: 64.71%
The results showed that Apple’s Buy & Hold strategy was the clear leader, delivering gains above +250%, while SPY’s Buy & Hold provided steady growth of over +100%. The RSI strategy achieved a more modest +42%, with a noticeably flatter equity curve.
This flatter curve reflects the strategy’s ability to avoid large drawdowns—especially during market sell-offs—by staying out of the market when RSI readings suggested weakness. However, it also meant missing significant upside during strong bull runs, where Buy & Hold fully benefited from compounding.
For risk-averse investors, the RSI strategy’s defensive nature could be attractive, offering smoother returns and reduced exposure during volatile periods. Still, the results highlight a trade-off: lower volatility often comes at the cost of lower long-term growth. The lag in re-entry after rebounds—due to RSI’s reliance on extreme thresholds—was especially evident during the post-dip rallies in 2020 and 2023.
Ready to Analyze Stocks?
Explore detailed financial data, analyst ratings, and technicals for thousands of stocks.
Analyze Stocks NowFinal Thought
The RSI endures as a valuable tool because markets are ultimately a reflection of human behavior—cycles of fear, greed, and exhaustion repeat again and again. When applied with discipline, RSI can help traders sidestep emotional decision-making, recognize weakening momentum, and position ahead of potential reversals.
Like any indicator, it is most effective when used as part of a broader strategy, complementing sound risk management and market awareness.
Happy Investing