iShares MSCI Global Energ... (FILL)
AMEX: FILL
· Real-Time Price · USD
25.09
0.01 (0.02%)
At close: Oct 01, 2025, 3:59 PM
25.15
0.24%
After-hours: Oct 01, 2025, 06:20 PM EDT
0.02% (1D)
| Bid | 24.85 |
| Market Cap | 60.22M |
| AUM | 80.54M |
| NAV | 25.17 |
| EPS (ttm) | 1.72 |
| PE Ratio (ttm) | 14.60 |
| Shares Out | 2.4M |
| Inception Date | Jan 31, 2012 |
| Ask | 27 |
| Volume | 2,256 |
| Open | 25.04 |
| Previous Close | 25.08 |
| Day's Range | 25.04 - 25.09 |
| 52-Week Range | 20.07 - 26.43 |
| Holdings | 184 |
| Expense Ratio | 0.40% |
About FILL
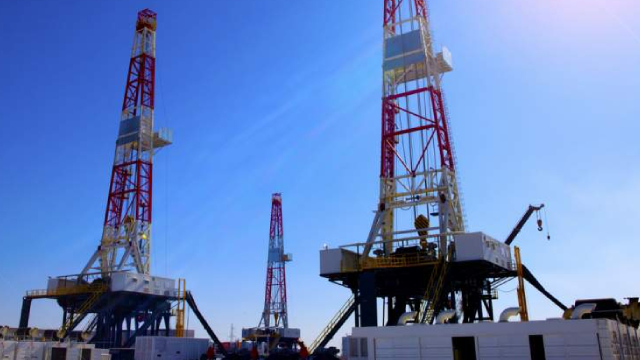
The iShares MSCI Global Energy Producers ETF seeks to track the investment results of an index composed of global equities of companies primarily engaged in the business of energy exploration and production.
Asset Class Equity
Ticker Symbol FILL
Inception Date Jan 31, 2012
Provider Blackrock
Website Fund Home Page
Exchange AMEX
Top 10 Holdings 44.62% of assets
| Name | Symbol | Weight |
|---|---|---|
| Exxon Mobil Corporat... | XOM | 18.08% |
| Chevron Corporation | CVX | 11.24% |
| Conocophillips | COP | 4.45% |
| Eog Resources, Inc. | EOG | 2.27% |
| Marathon Petroleum C... | MPC | 2.22% |
| Valero Energy Corpor... | VLO | 1.98% |
| Occidental Petroleum... | OXY | 1.30% |
| Eqt Corporation | EQT | 1.19% |
| Diamondback Energy, ... | FANG | 1.00% |
| Expand Energy Corpor... | EXE | 0.89% |
Dividends Dividend Yield 4.15%
| Ex-Dividend | Amount | Payment Date |
|---|---|---|
| Jun 16, 2025 | $0.4257 | Jun 20, 2025 |
| Dec 17, 2024 | $0.5851 | Dec 20, 2024 |
| Jun 11, 2024 | $0.4097 | Jun 17, 2024 |
| Dec 20, 2023 | $0.6017 | Dec 27, 2023 |
| Jun 7, 2023 | $0.4010 | Jun 13, 2023 |


