
Alpha Architect Internati... (IMOM)
NASDAQ: IMOM
· Real-Time Price · USD
36.62
-0.03 (-0.08%)
At close: Oct 01, 2025, 11:13 AM
-0.08% (1D)
| Bid | 36.41 |
| Market Cap | 114.07M |
| AUM | 112.8M |
| NAV | 35.53 |
| EPS (ttm) | 1.79 |
| PE Ratio (ttm) | 20.45 |
| Shares Out | 3.12M |
| Inception Date | Dec 22, 2015 |
| Ask | 37.03 |
| Volume | 2,379 |
| Open | 36.73 |
| Previous Close | 36.65 |
| Day's Range | 36.60 - 36.75 |
| 52-Week Range | 24.24 - 36.79 |
| Holdings | 53 |
| Expense Ratio | 0.39% |
About IMOM
We believe IMOM provides robust diversification with the potential for excess returns through consistent exposure to the strongest momentum stocks on the international market.
Asset Class Equity
Ticker Symbol IMOM
Inception Date Dec 22, 2015
Provider Alpha Architect
Website Fund Home Page
Exchange NASDAQ
Top Sectors
| Sector | Weight % |
|---|---|
| Industrials | 36.47% |
| Financial Services | 29.69% |
| Communication Services | 13.55% |
| Basic Materials | 10.37% |
| Consumer Cyclical | 5.99% |
Top 10 Holdings 22.86% of assets
| Name | Symbol | Weight |
|---|---|---|
| Zim Integrated Shipp... | ZIM | 2.38% |
| Rheinmetall Ag | RHM GR | 2.35% |
| Wisetech Global Ltd | WTC AU | 2.34% |
| Ns Solutions Corp | 2327 JP | 2.33% |
| Sanrio Co Ltd | 8136 JP | 2.33% |
| Sea Limited | SE | 2.32% |
| Advantest Corp | 6857 JP | 2.24% |
| Pro Medicus Ltd | PME AU | 2.21% |
| Jb Hi-fi Ltd | JBH AU | 2.18% |
| Telix Pharmaceutical... | TLX AU | 2.18% |
Dividends Dividend Yield 4.49%
| Ex-Dividend | Amount | Payment Date |
|---|---|---|
| Dec 24, 2024 | $1.2001 | Dec 31, 2024 |
| Dec 20, 2023 | $0.7768 | Dec 22, 2023 |
| Dec 29, 2022 | $1.5076 | Jan 6, 2023 |
| Dec 30, 2021 | $0.3588 | Jan 5, 2022 |
| Sep 13, 2021 | $0.0714 | Sep 20, 2021 |


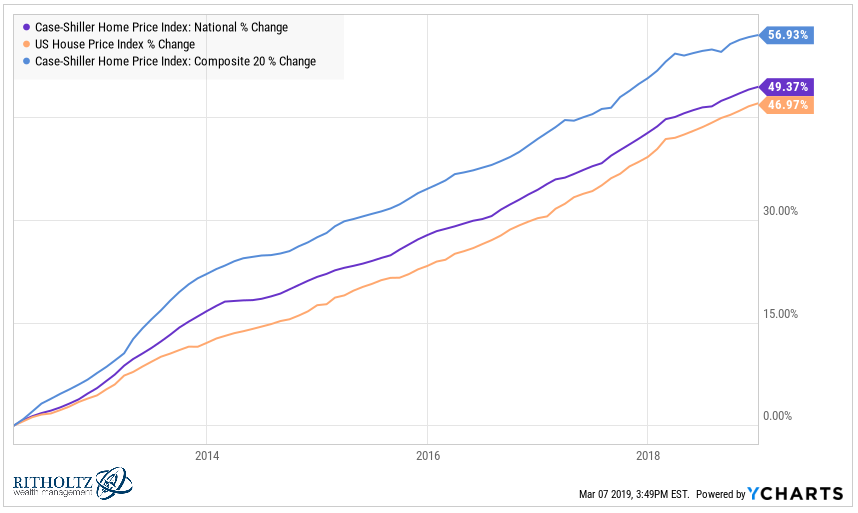
6 years ago · awealthofcommonsense.com
The Real Estate Market in Charts - A Wealth of Common SenseA study from BNP Paribas showed close to 60% of respondents felt owning a home was one of the top ingredients in the American Dream. Increasingly, this dream is out of reach for many young people. One...