Vanguard Utilities ETF (VPU)
AMEX: VPU
· Real-Time Price · USD
192.80
2.00 (1.05%)
At close: Oct 03, 2025, 3:59 PM
193.91
0.58%
After-hours: Oct 03, 2025, 06:14 PM EDT
1.05% (1D)
| Bid | 192.76 |
| Market Cap | 9.49B |
| AUM | 9.3B |
| NAV | 190.74 |
| EPS (ttm) | 8.58 |
| PE Ratio (ttm) | 22.47 |
| Shares Out | 49.22M |
| Inception Date | Jan 26, 2004 |
| Ask | 192.89 |
| Volume | 143,652 |
| Open | 191.31 |
| Previous Close | 190.80 |
| Day's Range | 191.23 - 194.54 |
| 52-Week Range | 154.00 - 194.45 |
| Holdings | 69 |
| Expense Ratio | 0.09% |
About VPU
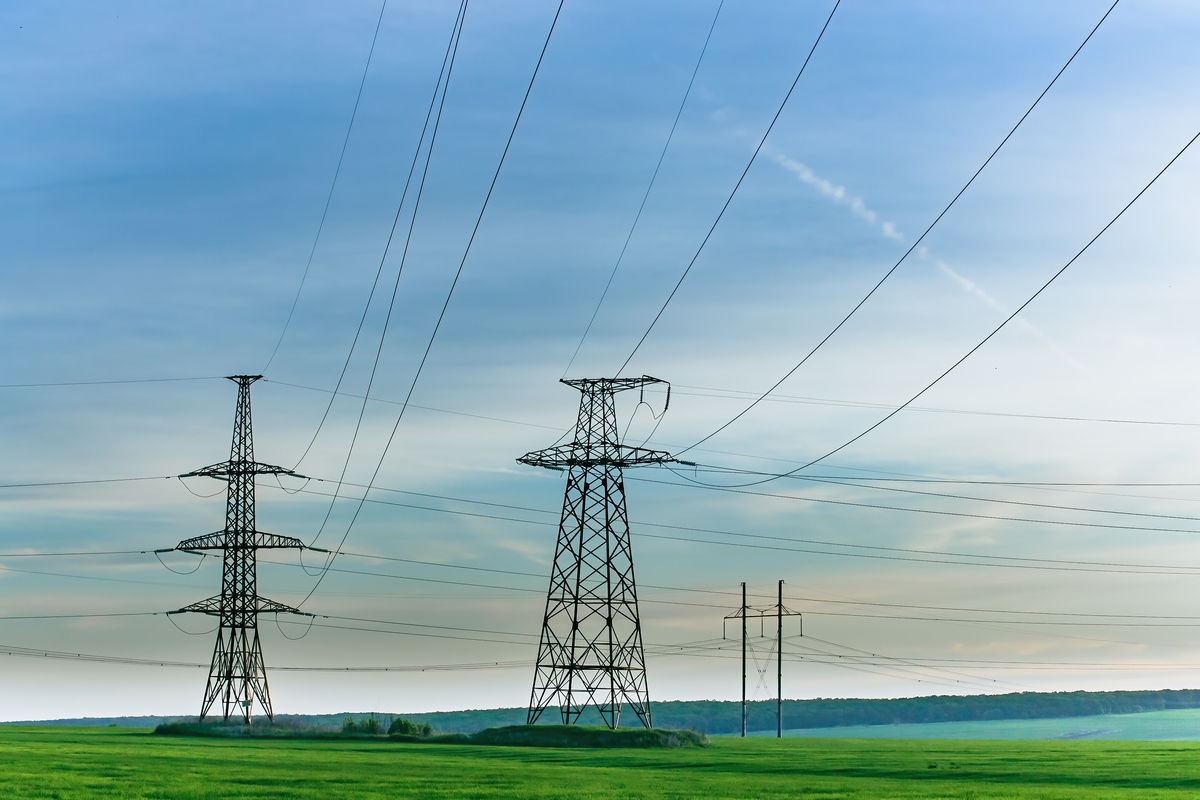
Seeks to track the performance of a benchmark index that measures the investment return of stocks in the utilities sector. Passively managed, using a full-replication strategy when possible and a sampling strategy if regulatory constraints dictate. Includes stocks of companies that distribute electricity, water, or gas, or that operate as independent power producers.
Asset Class Utilities
Ticker Symbol VPU
Inception Date Jan 26, 2004
Provider Vanguard
Website Fund Home Page
Exchange AMEX
Top Sectors
| Sector | Weight % |
|---|---|
| Utilities | 99.01% |
| Energy | 0.55% |
| Industrials | 0.43% |
| Basic Materials | 0.01% |
Top 10 Holdings 52.38% of assets
| Name | Symbol | Weight |
|---|---|---|
| Nextera Energy, Inc. | NEE | 10.34% |
| The Southern Company | SO | 6.78% |
| Constellation Energy... | CEG | 6.73% |
| Duke Energy Corporat... | DUK | 6.64% |
| Vistra Corp. | VST | 4.47% |
| American Electric Po... | AEP | 4.13% |
| Sempra | SRE | 3.75% |
| Dominion Energy, Inc... | D | 3.56% |
| Exelon Corporation | EXC | 3.07% |
| Xcel Energy Inc. | XEL | 2.91% |
Dividends Dividend Yield 2.64%
| Ex-Dividend | Amount | Payment Date |
|---|---|---|
| Sep 24, 2025 | $1.2267 | Sep 26, 2025 |
| Jun 26, 2025 | $1.2263 | Jun 30, 2025 |
| Mar 25, 2025 | $1.2275 | Mar 27, 2025 |
| Dec 18, 2024 | $1.2754 | Dec 20, 2024 |
| Sep 27, 2024 | $1.3117 | Oct 1, 2024 |
4 months ago
-1.38%
Utilities ETFs are trading lower. Weakness may be ...
Unlock content with
Pro Subscription