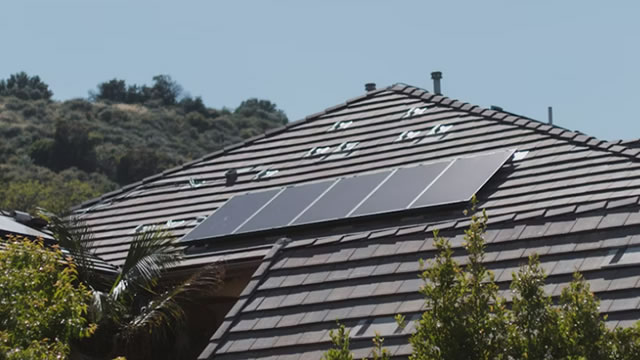
Sunnova Energy Internatio... (NOVA)
| Bid | 0.22 |
| Market Cap | 27.68M |
| Revenue (ttm) | 839.92M |
| Net Income (ttm) | -367.89M |
| EPS (ttm) | -2.96 |
| PE Ratio (ttm) | -0.07 |
| Forward PE | -0.07 |
| Analyst | n/a |
| Dividends | n/a |
| Ask | 0.22 |
| Volume | 6,865,208 |
| Avg. Volume (20D) | 14,449,192 |
| Open | 0.21 |
| Previous Close | 0.20 |
| Day's Range | 0.20 - 0.22 |
| 52-Week Range | 0.15 - 13.00 |
| Beta | 2.98 |
| Ex-Dividend Date | n/a |
About NOVA
undefined
Analysts project revenue of ... Unlock content with Pro Subscription

3 months ago · investopedia.com
Top Stock Movers Now: Warner Bros. Discovery, Boeing, Sunnova, and moreU.S. equities were mixed and little changed at midday as the markets awaited any news from the trade talks between the U.S. and China that began today. The S&P 500 and Nasdaq rose, but the Dow Jones I...

3 months ago · proactiveinvestors.com
Sunnova Energy files for bankruptcy amid mounting debt, industry challengesSunnova Energy (NYSE:NOVA), a major US residential solar and storage provider, has filed for Chapter 11 bankruptcy protection in Texas as it struggles with more than $10 billion in liabilities, weaken...

3 months ago · businesswire.com
KBRA Comments on Chapter 11 Filing of Sunnova Subsidiary and Reduction in WorkforceNEW YORK--(BUSINESS WIRE)-- #KBRA--In an 8-K filing on June 5, 2025, Sunnova Energy Corporation (Sunnova)—the sponsor and originator of 24 residential solar loan and lease transactions rated by KBRA1 ...

4 months ago · businesswire.com
KBRA Comments on Amendment to Sunnova's Loan Guarantee Agreement with DOENEW YORK--(BUSINESS WIRE)-- #creditratingagency--In an 8-K filing with the Securities and Exchange Commission on May 29, 2025, Sunnova Energy Corporation (Sunnova) disclosed that it had amended its Lo...


