Friedman Industries (FRD)
AI Score
Our AI model analyzes fundamental, technical, and statistical indicators
to predict the probability of a bullish trend over the next three months.
We regularly update and refine our models to deliver the most reliable forecasts
for you.
Bullish Probability | Sentiment | Score |
---|---|---|
+80% | Strong Buy | 10 |
+75% | Buy | 9 |
+70% | Buy | 8 |
+60% | Buy | 7 |
+50% | Hold | 6 |
+45% | Hold | 5 |
+40% | Hold | 4 |
+35% | Sell | 3 |
+30% | Sell | 2 |
+20% | Strong Sell | 1 |
14.14
-0.36 (-2.48%)
At close: Jan 14, 2025, 3:59 PM
13.96
-1.27%
After-hours Jan 14, 2025, 08:00 PM EST
undefined% (undefined)
Bid | 6.69 |
Market Cap | 98.51M |
Revenue (ttm) | - |
Net Income (ttm) | - |
EPS (ttm) | 1.14 |
PE Ratio (ttm) | 12.4 |
Forward PE | n/a |
Analyst | n/a |
Ask | 22.19 |
Volume | 6,798 |
Avg. Volume (20D) | 10,218 |
Open | 14.50 |
Previous Close | 14.50 |
Day's Range | 14.14 - 14.65 |
52-Week Range | 13.40 - 19.52 |
Beta | undefined |
About FRD
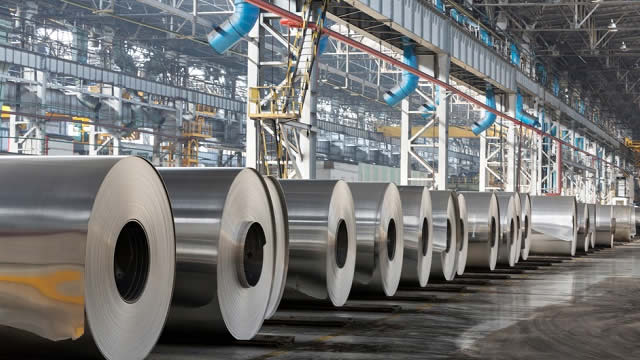
Friedman Industries, Incorporated engages in steel processing, pipe manufacturing and processing, and the steel and pipe distribution businesses the United States. It operates in two segments, Coil and Tubular. The Coil segment is involved in the conversion of steel coils into flat sheet and plate steel cut to customer specifications and reselling steel coils. This segment also processes customer-owned coils on a fee basis. The company sells coil...
Industry Steel
Sector Basic Materials
IPO Date Mar 17, 1980
Employees 268
Stock Exchange AMEX
Ticker Symbol FRD