
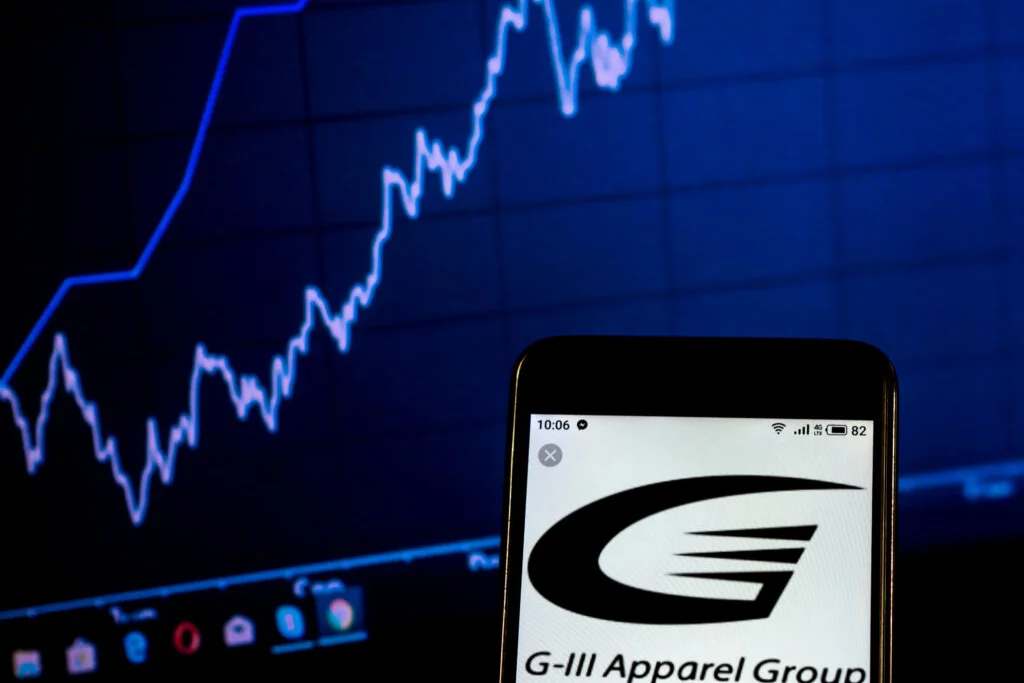
G-III Apparel Group Ltd. (GIII)
NASDAQ: GIII
· Real-Time Price · USD
27.30
-0.01 (-0.04%)
At close: Oct 16, 2025, 3:59 PM
27.30
0.00%
After-hours: Oct 16, 2025, 04:10 PM EDT
-0.04% (1D)
| Bid | 26.11 |
| Market Cap | 1.19B |
| Revenue (ttm) | 3.1B |
| Net Income (ttm) | 182.25M |
| EPS (ttm) | 3.97 |
| PE Ratio (ttm) | 6.88 |
| Forward PE | 10.01 |
| Analyst | Hold |
| Dividends | n/a |
| Ask | 28.51 |
| Volume | 297,263 |
| Avg. Volume (20D) | 566,600 |
| Open | 27.28 |
| Previous Close | 27.31 |
| Day's Range | 26.82 - 27.48 |
| 52-Week Range | 20.33 - 36.18 |
| Beta | 1.58 |
| Ex-Dividend Date | n/a |
About GIII
undefined
Industry n/a
Sector n/a
IPO Date n/a
Employees NaN
Stock Exchange n/a
Ticker Symbol GIII
Website n/a
Analyst Forecast
According to 0 analyst ratings, the average rating for GIII stock is "n/a." The 12-month stock price forecast is $n/a, which is a decrease of 0% from the latest price.
Stock ForecastsG-III Apparel Group Ltd. is scheduled to release its earnings on
Dec 9, 2025,
before market opens.
Analysts project revenue of ... Unlock content with Pro Subscription
Analysts project revenue of ... Unlock content with Pro Subscription
1 month ago
-6.04%
Shares of apparel related stocks are trading lower...
Unlock content with
Pro Subscription
1 month ago
+3.61%
Shares of apparel stocks are trading higher amid overall market strength after Fed Chair Powell said restrictive policy and shifting risks may warrant adjusting the Fed's stance.


1 month ago · seekingalpha.com
G-III Apparel Group, Ltd. (GIII) Q2 2026 Earnings Call TranscriptG-III Apparel Group, Ltd. (NASDAQ:GIII ) Q2 2026 Earnings Call September 4, 2025 8:30 AM EDT Company Participants Neal Nackman - CFO & Treasurer Morris Goldfarb - Chairman & CEO Conference Call Partic...


2 months ago · seekingalpha.com
G-III Apparel Group: Undervalued With Large Potential For GrowthG-III's vast owned and licensed brand portfolio and strategic partnerships drive growth and competitive advantage in the apparel industry. Recent financial performance shows strong growth in net sales...