Unilever (UL)
| Bid | 60.56 |
| Market Cap | 150.63B |
| Revenue (ttm) | 59.77B |
| Net Income (ttm) | 5.55B |
| EPS (ttm) | 2.6 |
| PE Ratio (ttm) | 23.42 |
| Forward PE | 16.55 |
| Analyst | Buy |
| Dividends | $1.99 |
| Ask | 61 |
| Volume | 5,690,161 |
| Avg. Volume (20D) | 2,367,773 |
| Open | 60.23 |
| Previous Close | 60.99 |
| Day's Range | 60.20 - 60.95 |
| 52-Week Range | 54.32 - 65.66 |
| Beta | 0.25 |
| Ex-Dividend Date | Aug 15, 2025 |
Analyst Forecast
According to 0 analyst ratings, the average rating for UL stock is "n/a." The 12-month stock price forecast is $n/a, which is a decrease of 0% from the latest price.
Stock Forecasts

5 days ago · proactiveinvestors.co.uk
Tough year for Unilever, but consumer staples giant can power throughIt has been a tough year for the consumer goods giants, and Unilever PLC (LSE:ULVR) finds itself squarely in the crosshairs of a nervous market. JP Morgan thinks investors should brace for a choppy re...
1 week ago · proactiveinvestors.co.uk
Bank keeps Unilever faith with despite tricky patch for consumer goods giantCiti has kept faith with Unilever PLC (LSE:ULVR) despite a tricky near-term outlook, reiterating its “buy” rating and £52 target price even as it warns that third-quarter growth may leave investors un...

4 weeks ago · youtube.com
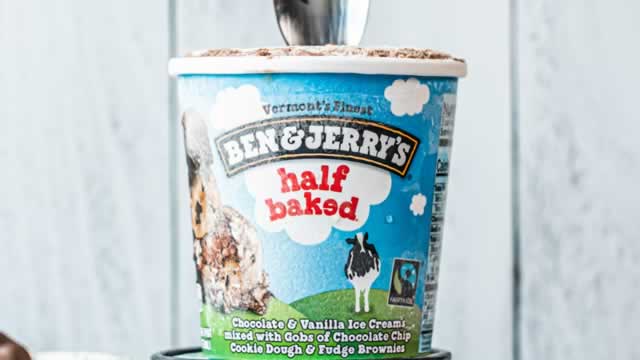
Ben & Jerry's is now just…BenJerry Greenfield has been at odds with Unilever over his social activism.
4 weeks ago · businessinsider.com
The Jerry from Ben & Jerry's has quit — and is criticizing parent company Unilever on his way outBen & Jerry's cofounder Jerry Greenfield is leaving the ice cream brand. Greenfield said he had experienced pushback from parent company Unilever on the brand's advocacy on social issues.