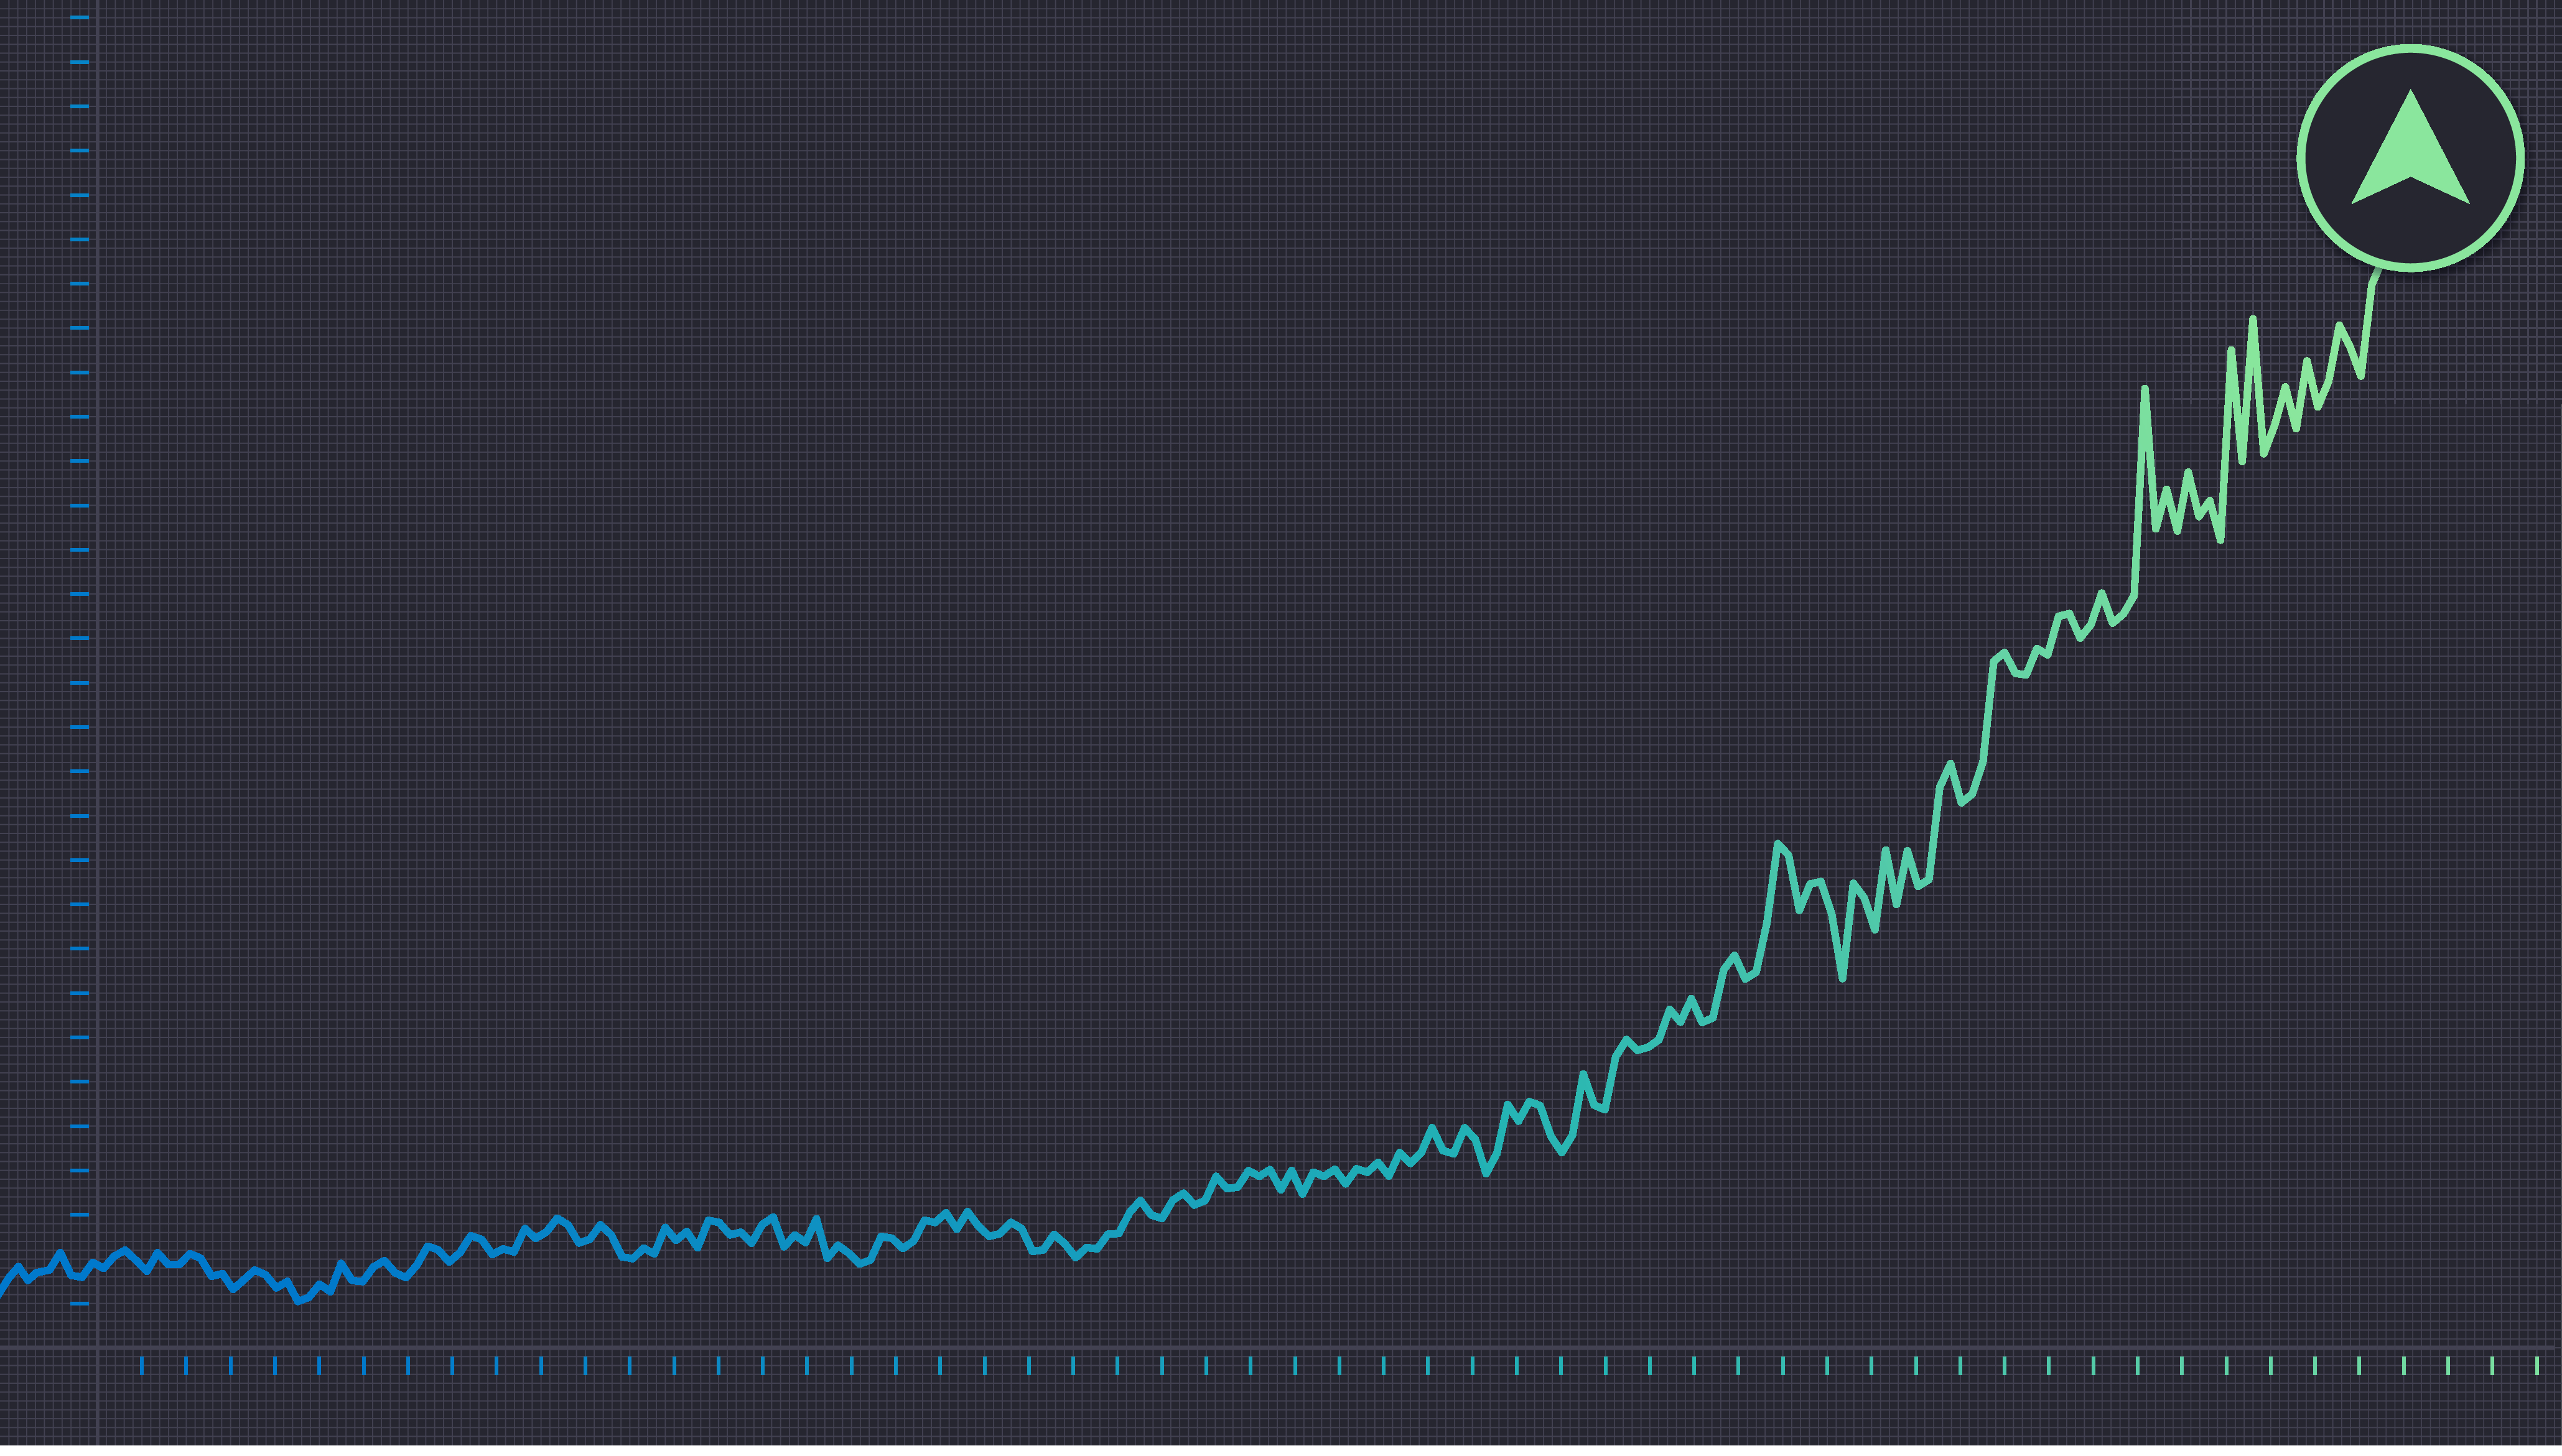
AppLovin Corporation (APP)
NASDAQ: APP
· Real-Time Price · USD
682.51
-1.13 (-0.17%)
At close: Oct 03, 2025, 2:32 PM
-0.17% (1D)
| Bid | 682.12 |
| Market Cap | 230.85B |
| Revenue (ttm) | 5.31B |
| Net Income (ttm) | 2.43B |
| EPS (ttm) | 7.25 |
| PE Ratio (ttm) | 94.14 |
| Forward PE | 49.9 |
| Analyst | Buy |
| Dividends | n/a |
| Ask | 682.9 |
| Volume | 3,176,169 |
| Avg. Volume (20D) | 7,222,350 |
| Open | 693.00 |
| Previous Close | 683.64 |
| Day's Range | 673.17 - 695.00 |
| 52-Week Range | 135.50 - 745.61 |
| Beta | 2.44 |
| Ex-Dividend Date | n/a |
Analyst Forecast
According to 0 analyst ratings, the average rating for APP stock is "n/a." The 12-month stock price forecast is $n/a, which is a decrease of 0% from the latest price.
Stock ForecastsAppLovin Corporation is scheduled to release its earnings on
Nov 5, 2025,
after market closes.
Analysts project revenue of ... Unlock content with Pro Subscription
Analysts project revenue of ... Unlock content with Pro Subscription
4 days ago
+6.34%
Applovin Corporation shares are trading higher aft...
Unlock content with
Pro Subscription
1 week ago
+4.68%
Applovin shares are trading higher after multiple analysts raised their price targets on the stock.