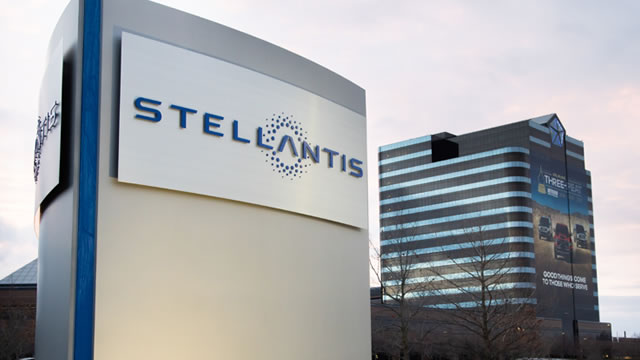
Stellantis N.V. (STLA)
NYSE: STLA
· Real-Time Price · USD
10.12
0.21 (2.12%)
At close: Oct 15, 2025, 3:59 PM
10.04
-0.74%
After-hours: Oct 15, 2025, 04:33 PM EDT
2.12% (1D)
| Bid | 10.08 |
| Market Cap | 29.22B |
| Revenue (ttm) | 231.14B |
| Net Income (ttm) | 3.23B |
| EPS (ttm) | -0.93 |
| PE Ratio (ttm) | -10.88 |
| Forward PE | 5.38 |
| Analyst | Hold |
| Dividends | $2.42 |
| Ask | 10.13 |
| Volume | 18,324,712 |
| Avg. Volume (20D) | 20,018,932.6 |
| Open | 9.96 |
| Previous Close | 9.91 |
| Day's Range | 9.90 - 10.15 |
| 52-Week Range | 8.39 - 14.28 |
| Beta | 1.15 |
| Ex-Dividend Date | Apr 23, 2025 |
About STLA
undefined
Industry n/a
Sector n/a
IPO Date n/a
Employees NaN
Stock Exchange n/a
Ticker Symbol STLA
Website n/a
Analyst Forecast
According to 0 analyst ratings, the average rating for STLA stock is "n/a." The 12-month stock price forecast is $n/a, which is a decrease of 0% from the latest price.
Stock Forecasts5 days ago
-7.37%
Shares of auto and auto-related companies are trad...
Unlock content with
Pro Subscription
1 week ago
+7.88%
Stellantis shares are trading higher following reports suggesting that the company is considering a potential sale of its car-sharing business Free2move.
11 hours ago · proactiveinvestors.com
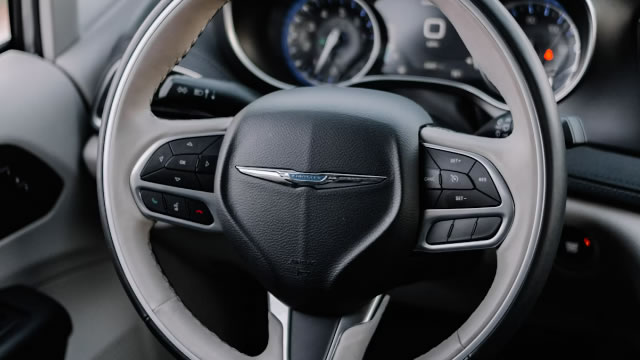
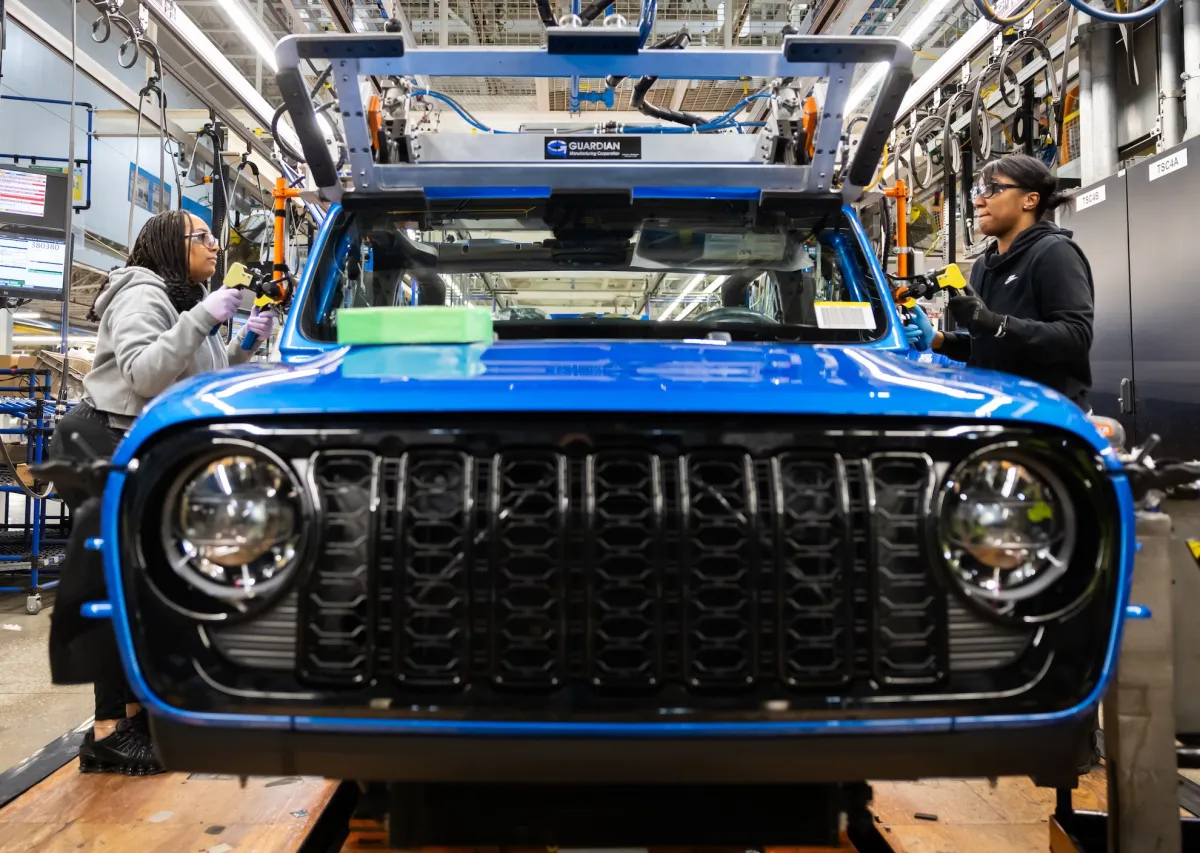
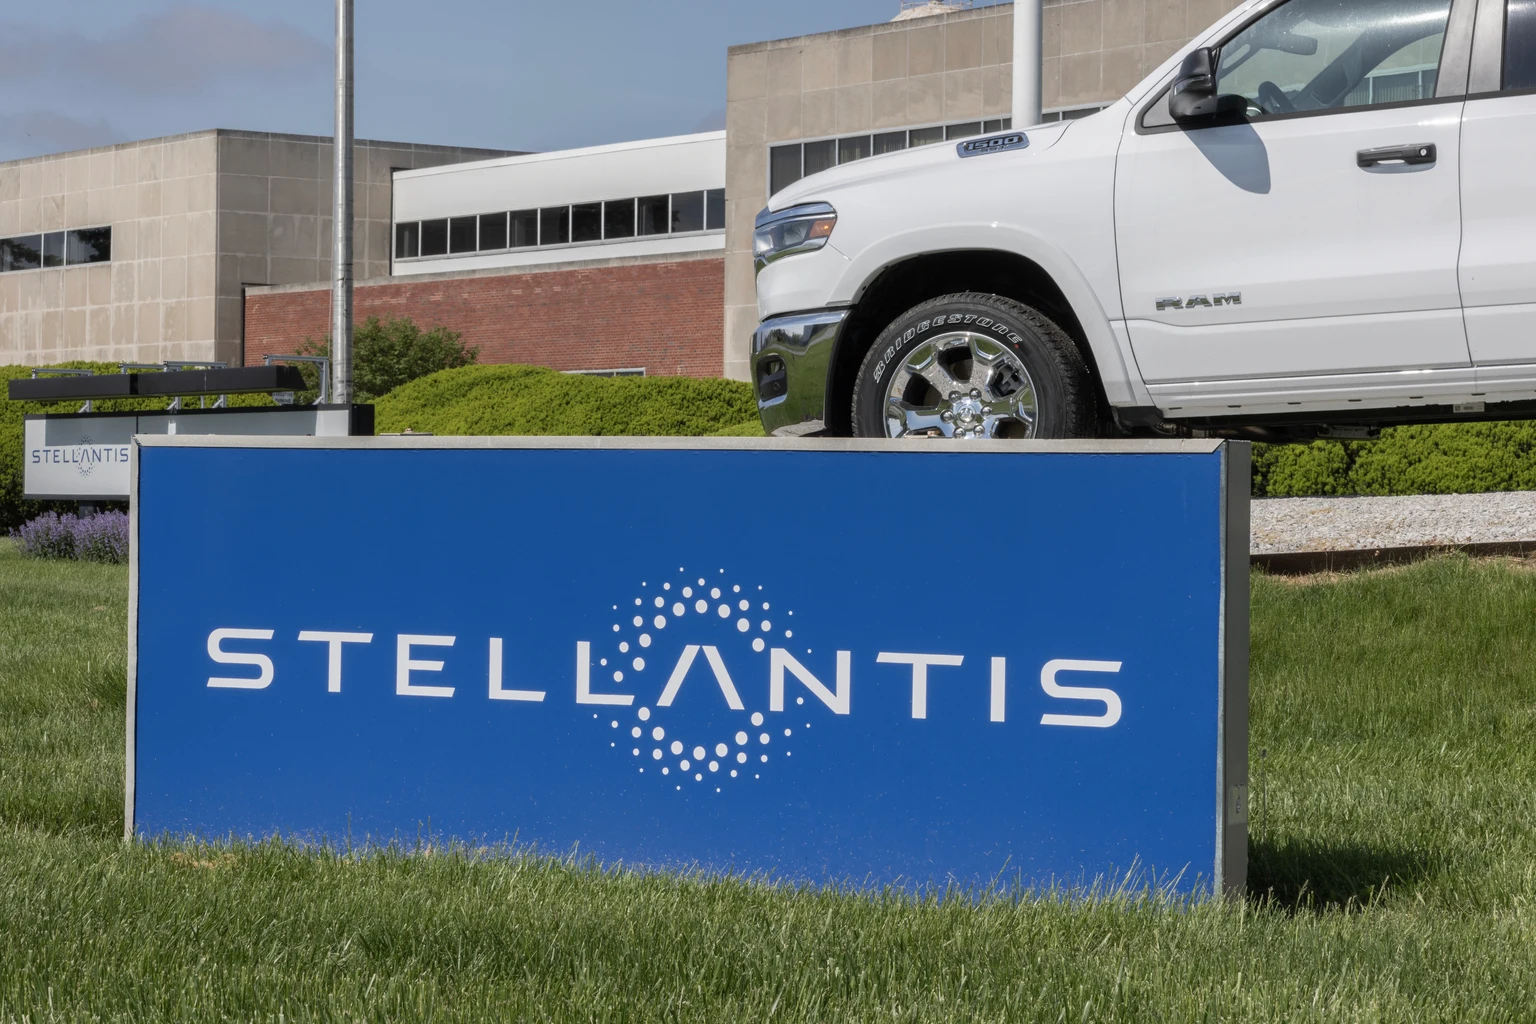
Stellantis to invest $13B in US manufacturing, expects to create 5,000 new jobsStellantis NV (NYSE:STLA, EPA:STLA) announced late Tuesday that it will invest $13 billion to expand its manufacturing capacity in the American market over the next four years, its single largest inve...

15 hours ago · seekingalpha.com
Wall Street Breakfast Podcast: Stellantis Bets On U.S. ProductionStellantis (STLA) announces a record $13B U.S. manufacturing investment, expanding production capacity by 50% and introducing five new vehicles. STLA's investment will reopen and upgrade key plants an...